
Google Security Blog
Your Google Account allows you to create passkeys on your phone, computer and security keys
Last year, Google launched passkey support for Google Accounts. Passkeys are a new industry standard that give users an easy, highly secure way to sign-in to apps and websites. Today, we announced that passkeys have been used to authenticate users more than 1 billion times across over 400 million Google Accounts.
As more users encounter passkeys, we’re often asked questions about how they relate to security keys, how Google Workspace administrators can configure passkeys for the user accounts that they manage, and how they relate to the Advanced Protection Program (APP). This post will seek to clarify these topics.
Passkeys and security keys
Passkeys are an evolution of security keys, meaning users get the same security benefits, but with a much simplified experience. Passkeys can be used in the Google Account sign-in process in many of the same ways that security keys have been used in the past — in fact, you can now choose to store your passkey on your security key. This provides users with three key benefits:
Stronger security. Users typically authenticate with passkeys by entering their device’s screen lock PIN, or using a biometric authentication method, like a fingerprint or a face scan. By storing the passkey on a security key, users can ensure that passkeys are only available when the security key is plugged into their device, creating a stronger security posture.
Flexible portability. Today, users rely on password managers to make passkeys available across all of their devices. Security keys provide an alternate way to use your passkeys across your devices: by bringing your security keys with you.
Simpler sign-in. Passkeys can act as a first- and second-factor, simultaneously. By creating a passkey on your security key, you can skip entering your password. This replaces your remotely stored password with the PIN you used to unlock your security key, which improves user security. (If you prefer to continue using your password in addition to using a passkey, you can turn off “Skip password when possible” in your Google Account security settings.)
Passkeys bring strong and phishing-resistant authentication technology to a wider user base, and we’re excited to offer this new way for passkeys to meet more user needs.
Google Workspace admins have additional controls and choice
Google Workspace accounts have a domain level “Allow users to skip passwords at sign-in by using passkeys” setting which is off by default, and overrides the corresponding user-level configuration. This retains the need for a user’s password in addition to presenting a passkey. Admins can also change that setting and allow users to sign-in with just a passkey.
When the domain-level setting is off, end users will still see a “use a security key” button on their “passkeys and security keys” page, which will attempt to enroll any security key for use as a second factor only. This action will not require the user to set up a PIN for their security key during registration. This is designed to give enterprise customers who have deployed legacy security keys additional time to make the change to passkeys, with or without a password.
Passkeys for Advanced Protection Program (APP) users
Since the introduction of passkeys in 2023, users enrolled in APP have been able to add any passkey to their account and use it to sign in. However users are still required to present two security keys when enrolling into the program. We will be updating the enrollment process soon to enable a user with any passkey to enroll in APP. By allowing any passkey to be used (rather than only hardware security keys) we expect to reach more high risk users who need advanced protection, while maintaining phishing-resistant authentication.
Detecting browser data theft using Windows Event Logs
Chromium's sandboxed process model defends well from malicious web content, but there are limits to how well the application can protect itself from malware already on the computer. Cookies and other credentials remain a high value target for attackers, and we are trying to tackle this ongoing threat in multiple ways, including working on web standards like DBSC that will help disrupt the cookie theft industry since exfiltrating these cookies will no longer have any value.
Where it is not possible to prevent the theft of credentials and cookies by malware, the next best thing is making the attack more observable by antivirus, endpoint detection agents, or enterprise administrators with basic log analysis tools.
This blog describes one set of signals for use by system administrators or endpoint detection agents that should reliably flag any access to the browser’s protected data from another application on the system. By increasing the likelihood of an attack being detected, this changes the calculus for those attackers who might have a strong desire to remain stealthy, and might cause them to rethink carrying out these types of attacks against our users.
Background
Chromium based browsers on Windows use the DPAPI (Data Protection API) to secure local secrets such as cookies, password etc. against theft. DPAPI protection is based on a key derived from the user's login credential and is designed to protect against unauthorized access to secrets from other users on the system, or when the system is powered off. Because the DPAPI secret is bound to the logged in user, it cannot protect against local malware attacks — malware executing as the user or at a higher privilege level can just call the same APIs as the browser to obtain the DPAPI secret.
Since 2013, Chromium has been applying the CRYPTPROTECT_AUDIT flag to DPAPI calls to request that an audit log be generated when decryption occurs, as well as tagging the data as being owned by the browser. Because all of Chromium's encrypted data storage is backed by a DPAPI-secured key, any application that wishes to decrypt this data, including malware, should always reliably generate a clearly observable event log, which can be used to detect these types of attacks.
There are three main steps involved in taking advantage of this log:
- Enable logging on the computer running Google Chrome, or any other Chromium based browser.
- Export the event logs to your backend system.
- Create detection logic to detect theft.
This blog will also show how the logging works in practice by testing it against a python password stealer.
Step 1: Enable logging on the system
DPAPI events are logged into two places in the system. Firstly, there is the 4693 event that can be logged into the Security Log. This event can be enabled by turning on "Audit DPAPI Activity" and the steps to do this are described here, the policy itself sits deep within Security Settings -> Advanced Audit Policy Configuration -> Detailed Tracking.
Here is what the 4693 event looks like:
<Event xmlns="http://schemas.microsoft.com/win/2004/08/events/event"> <System> <Provider Name="Microsoft-Windows-Security-Auditing" Guid="{...}" /> <EventID>4693</EventID> <Version>0</Version> <Level>0</Level> <Task>13314</Task> <Opcode>0</Opcode> <Keywords>0x8020000000000000</Keywords> <TimeCreated SystemTime="2015-08-22T06:25:14.589407700Z" /> <EventRecordID>175809</EventRecordID> <Correlation /> <Execution ProcessID="520" ThreadID="1340" /> <Channel>Security</Channel> <Computer>DC01.contoso.local</Computer> <Security /> </System> <EventData> <Data Name="SubjectUserSid">S-1-5-21-3457937927-2839227994-823803824-1104</Data> <Data Name="SubjectUserName">dadmin</Data> <Data Name="SubjectDomainName">CONTOSO</Data> <Data Name="SubjectLogonId">0x30d7c</Data> <Data Name="MasterKeyId">0445c766-75f0-4de7-82ad-d9d97aad59f6</Data> <Data Name="RecoveryReason">0x5c005c</Data> <Data Name="RecoveryServer">DC01.contoso.local</Data> <Data Name="RecoveryKeyId" /> <Data Name="FailureId">0x380000</Data> </EventData> </Event>The issue with the 4693 event is that while it is generated if there is DPAPI activity on the system, it unfortunately does not contain information about which process was performing the DPAPI activity, nor does it contain information about which particular secret is being accessed. This is because the Execution ProcessID field in the event will always be the process id of lsass.exe because it is this process that manages the encryption keys for the system, and there is no entry for the description of the data.
It was for this reason that, in recent versions of Windows a new event type was added to help identify the process making the DPAPI call directly. This event was added to the Microsoft-Windows-Crypto-DPAPI stream which manifests in the Event Log in the Applications and Services Logs > Microsoft > Windows > Crypto-DPAPI part of the Event Viewer tree.
The new event is called DPAPIDefInformationEvent and has id 16385, but unfortunately is only emitted to the Debug channel and by default this is not persisted to an Event Log, unless Debug channel logging is enabled. This can be accomplished by enabling it directly in powershell:
$log = ` New-Object System.Diagnostics.Eventing.Reader.EventLogConfiguration ` Microsoft-Windows-Crypto-DPAPI/Debug $log.IsEnabled = $True $log.SaveChanges()Once this log is enabled then you should start to see 16385 events generated, and these will contain the real process ids of applications performing DPAPI operations. Note that 16385 events are emitted by the operating system even for data not flagged with CRYPTPROTECT_AUDIT, but to identify the data as owned by the browser, the data description is essential. 16385 events are described later.
You will also want to enable Audit Process Creation in order to be able to know a current mapping of process ids to process names — more details on that later. You might want to also consider enabling logging of full command lines.
Step 2: Collect the events
The events you want to collect are:
- From Security log:
- 4688: "A new process was created."
- From Microsoft-Windows-Crypto-DPAPI/Debug log: (enabled above)
- 16385: "DPAPIDefInformationEvent"
These should be collected from all workstations, and persisted into your enterprise logging system for analysis.
Step 3: Write detection logic to detect theft.
With these two events is it now possible to detect when an unauthorized application calls into DPAPI to try and decrypt browser secrets.
The general approach is to generate a map of process ids to active processes using the 4688 events, then every time a 16385 event is generated, it is possible to identify the currently running process, and alert if the process does not match an authorized application such as Google Chrome. You might find your enterprise logging software can already keep track of which process ids map to which process names, so feel free to just use that existing functionality.
Let's dive deeper into the events.
A 4688 event looks like this - e.g. here is Chrome browser launching from explorer:
<Event xmlns="http://schemas.microsoft.com/win/2004/08/events/event"> <System> <Provider Name="Microsoft-Windows-Security-Auditing" Guid="{...}" /> <EventID>4688</EventID> <Version>2</Version> <Level>0</Level> <Task>13312</Task> <Opcode>0</Opcode> <Keywords>0x8020000000000000</Keywords> <TimeCreated SystemTime="2024-03-28T20:06:41.9254105Z" /> <EventRecordID>78258343</EventRecordID> <Correlation /> <Execution ProcessID="4" ThreadID="54256" /> <Channel>Security</Channel> <Computer>WIN-GG82ULGC9GO.contoso.local</Computer> <Security /> </System> <EventData> <Data Name="SubjectUserSid">S-1-5-18</Data> <Data Name="SubjectUserName">WIN-GG82ULGC9GO$</Data> <Data Name="SubjectDomainName">CONTOSO</Data> <Data Name="SubjectLogonId">0xe8c85cc</Data> <Data Name="NewProcessId">0x17eac</Data> <Data Name="NewProcessName">C:\Program Files\Google\Chrome\Application\chrome.exe</Data> <Data Name="TokenElevationType">%%1938</Data> <Data Name="ProcessId">0x16d8</Data> <Data Name="CommandLine">"C:\Program Files\Google\Chrome\Application\chrome.exe" </Data> <Data Name="TargetUserSid">S-1-0-0</Data> <Data Name="TargetUserName">-</Data> <Data Name="TargetDomainName">-</Data> <Data Name="TargetLogonId">0x0</Data> <Data Name="ParentProcessName">C:\Windows\explorer.exe</Data> <Data Name="MandatoryLabel">S-1-16-8192</Data> </EventData> </Event>The important part here is the NewProcessId, in hex 0x17eac which is 97964.
A 16385 event looks like this:
<Event xmlns="http://schemas.microsoft.com/win/2004/08/events/event"> <System> <Provider Name="Microsoft-Windows-Crypto-DPAPI" Guid="{...}" /> <EventID>16385</EventID> <Version>0</Version> <Level>4</Level> <Task>64</Task> <Opcode>0</Opcode> <Keywords>0x2000000000000040</Keywords> <TimeCreated SystemTime="2024-03-28T20:06:42.1772585Z" /> <EventRecordID>826993</EventRecordID> <Correlation ActivityID="{777bf68d-7757-0028-b5f6-7b775777da01}" /> <Execution ProcessID="1392" ThreadID="57108" /> <Channel>Microsoft-Windows-Crypto-DPAPI/Debug</Channel> <Computer>WIN-GG82ULGC9GO.contoso.local</Computer> <Security UserID="S-1-5-18" /> </System> <EventData> <Data Name="OperationType">SPCryptUnprotect</Data> <Data Name="DataDescription">Google Chrome</Data> <Data Name="MasterKeyGUID">{4df0861b-07ea-49f4-9a09-1d66fd1131c3}</Data> <Data Name="Flags">0</Data> <Data Name="ProtectionFlags">16</Data> <Data Name="ReturnValue">0</Data> <Data Name="CallerProcessStartKey">32651097299526713</Data> <Data Name="CallerProcessID">97964</Data> <Data Name="CallerProcessCreationTime">133561300019253302</Data> <Data Name="PlainTextDataSize">32</Data> </EventData> </Event>The important parts here are the OperationType, the DataDescription and the CallerProcessID.
For DPAPI decrypts, the OperationType will be SPCryptUnprotect.
Each Chromium based browser will tag its data with the product name, e.g. Google Chrome, or Microsoft Edge depending on the owner of the data. This will always appear in the DataDescription field, so it is possible to distinguish browser data from other DPAPI secured data.
Finally, the CallerProcessID will map to the process performing the decryption. In this case, it is 97964 which matches the process ID seen in the 4688 event above, showing that this was likely Google Chrome decrypting its own data! Bear in mind that since these logs only contain the path to the executable, for a full assurance that this is actually Chrome (and not malware pretending to be Chrome, or malware injecting into Chrome), additional protections such as removing administrator access, and application allowlisting could also be used to give a higher assurance of this signal. In recent versions of Chrome or Edge, you might also see logs of decryptions happening in the elevation_service.exe process, which is another legitimate part of the browser's data storage.
To detect unauthorized DPAPI access, you will want to generate a running map of all processes using 4688 events, then look for 16385 events that have a CallerProcessID that does not match a valid caller – Let's try that now.
Testing with a python password stealer
We can test that this works with a public script to decrypt passwords taken from a public blog. It generates two events, as expected:
Here is the 16385 event, showing that a process is decrypting the "Google Chrome" key.
<Event xmlns="http://schemas.microsoft.com/win/2004/08/events/event"> <System> < ... > <EventID>16385</EventID> < ... > <TimeCreated SystemTime="2024-03-28T20:28:13.7891561Z" /> < ... > </System> <EventData> <Data Name="OperationType">SPCryptUnprotect</Data> <Data Name="DataDescription">Google Chrome</Data> < ... > <Data Name="CallerProcessID">68768</Data> <Data Name="CallerProcessCreationTime">133561312936527018</Data> <Data Name="PlainTextDataSize">32</Data> </EventData> </Event>Since the data description being decrypted was "Google Chrome" we know this is an attempt to read Chrome secrets, but to determine the process behind 68768 (0x10ca0), we need to correlate this with a 4688 event.
Here is the corresponding 4688 event from the Security Log (a process start for python3.exe) with the matching process id:
<Event xmlns="http://schemas.microsoft.com/win/2004/08/events/event"> <System> < ... > <EventID>4688</EventID> < ... > <TimeCreated SystemTime="2024-03-28T20:28:13.6527871Z" /> < ... > </System> <EventData> < ... > <Data Name="NewProcessId">0x10ca0</Data> <Data Name="NewProcessName">C:\python3\bin\python3.exe</Data> <Data Name="TokenElevationType">%%1938</Data> <Data Name="ProcessId">0xca58</Data> <Data Name="CommandLine">"c:\python3\bin\python3.exe" steal_passwords.py</Data> < ... > <Data Name="ParentProcessName">C:\Windows\System32\cmd.exe</Data> </EventData> </Event>In this case, the process id matches the python3 executable running a potentially malicious script, so we know this is likely very suspicious behavior, and should trigger an alert immediately! Bear in mind process ids on Windows are not unique so you will want to make sure you use the 4688 event with the timestamp closest, but earlier than, the 16385 event.
Summary
This blog has described a technique for strong detection of cookie and credential theft. We hope that all defenders find this post useful. Thanks to Microsoft for adding the DPAPIDefInformationEvent log type, without which this would not be possible.
How we fought bad apps and bad actors in 2023
A safe and trusted Google Play experience is our top priority. We leverage our SAFE (see below) principles to provide the framework to create that experience for both users and developers. Here's what these principles mean in practice:
- (S)afeguard our Users. Help them discover quality apps that they can trust.
- (A)dvocate for Developer Protection. Build platform safeguards to enable developers to focus on growth.
- (F)oster Responsible Innovation. Thoughtfully unlock value for all without compromising on user safety.
- (E)volve Platform Defenses. Stay ahead of emerging threats by evolving our policies, tools and technology.
With those principles in mind, we’ve made recent improvements and introduced new measures to continue to keep Google Play’s users safe, even as the threat landscape continues to evolve. In 2023, we prevented 2.28 million policy-violating apps from being published on Google Play1 in part thanks to our investment in new and improved security features, policy updates, and advanced machine learning and app review processes. We have also strengthened our developer onboarding and review processes, requiring more identity information when developers first establish their Play accounts. Together with investments in our review tooling and processes, we identified bad actors and fraud rings more effectively and banned 333K bad accounts from Play for violations like confirmed malware and repeated severe policy violations.
Additionally, almost 200K app submissions were rejected or remediated to ensure proper use of sensitive permissions such as background location or SMS access. To help safeguard user privacy at scale, we partnered with SDK providers to limit sensitive data access and sharing, enhancing the privacy posture for over 31 SDKs impacting 790K+ apps. We also significantly expanded the Google Play SDK Index, which now covers the SDKs used in almost 6 million apps across the Android ecosystem. This valuable resource helps developers make better SDK choices, boosts app quality and minimizes integration risks.
Protecting the Android EcosystemBuilding on our success with the App Defense Alliance (ADA), we partnered with Microsoft and Meta as steering committee members in the newly restructured ADA under the Joint Development Foundation, part of the Linux Foundation family. The Alliance will support industry-wide adoption of app security best practices and guidelines, as well as countermeasures against emerging security risks.
Additionally, we announced new Play Store transparency labeling to highlight VPN apps that have completed an independent security review through App Defense Alliance’s Mobile App Security Assessment (MASA). When a user searches for VPN apps, they will now see a banner at the top of Google Play that educates them about the “Independent security review” badge in the Data safety section. This helps users see at-a-glance that a developer has prioritized security and privacy best practices and is committed to user safety.
To better protect our customers who install apps outside of the Play Store, we made Google Play Protect’s security capabilities even more powerful with real-time scanning at the code-level to combat novel malicious apps. Our security protections and machine learning algorithms learn from each app submitted to Google for review and we look at thousands of signals and compare app behavior. This new capability has already detected over 5 million new, malicious off-Play apps, which helps protect Android users worldwide.
More Stringent Developer Requirements and GuidelinesLast year we updated Play policies around Generative AI apps, disruptive notifications, and expanded privacy protections. We also are raising the bar for new personal developer accounts by requiring new testing requirements before developers can make their app available on Google Play. By testing their apps, getting feedback and ensuring everything is ready before they launch, developers are able to bring more high quality content to Play users. In order to increase trust and transparency, we’ve introduced expanded developer verification requirements, including D-U-N-S numbers for organizations and a new “About the developer” section.
To give users more control over their personal data, apps that enable account creation now need to provide an option to initiate account and data deletion from within the app and online. This web requirement is especially important so that a user can request account and data deletion without having to reinstall an app. To simplify the user experience, we have also incorporated this as a feature within the Data safety section of the Play Store.
With each iteration of the Android operating system (including its robust set of APIs), a myriad of enhancements are introduced, aiming to elevate the user experience, bolster security protocols, and optimize the overall performance of the Android platform. To further safeguard our customers, approximately 1.5 million applications that do not target the most recent APIs are no longer available in the Play Store to new users who have updated their devices to the latest Android version.
Looking AheadProtecting users and developers on Google Play is paramount and ever-evolving. We're launching new security initiatives in 2024, including removing apps from Play that are not transparent about their privacy practices.
We also recently filed a lawsuit in federal court against two fraudsters who made multiple misrepresentations to upload fraudulent investment and crypto exchange apps on Play to scam users. This lawsuit is a critical step in holding these bad actors accountable and sending a clear message that we will aggressively pursue those who seek to take advantage of our users.
We're constantly working on new ways to protect your experience on Google Play and across the entire Android ecosystem, and we look forward to sharing more.
Notes-
In accordance with the EU's Digital Services Act (DSA) reporting requirements, Google Play now calculates policy violations based on developer communications sent. ↩
Accelerating incident response using generative AI
Introduction
As security professionals, we're constantly looking for ways to reduce risk and improve our workflow's efficiency. We've made great strides in using AI to identify malicious content, block threats, and discover and fix vulnerabilities. We also published the Secure AI Framework (SAIF), a conceptual framework for secure AI systems to ensure we are deploying AI in a responsible manner.
Today we are highlighting another way we use generative AI to help the defenders gain the advantage: Leveraging LLMs (Large Language Model) to speed-up our security and privacy incidents workflows.
Incident management is a team sport. We have to summarize security and privacy incidents for different audiences including executives, leads, and partner teams. This can be a tedious and time-consuming process that heavily depends on the target group and the complexity of the incident. We estimate that writing a thorough summary can take nearly an hour and more complex communications can take multiple hours. But we hypothesized that we could use generative AI to digest information much faster, freeing up our incident responders to focus on other more critical tasks - and it proved true. Using generative AI we could write summaries 51% faster while also improving the quality of them.
When suspecting a potential data incident, for example,we follow a rigorous process to manage it. From the identification of the problem, the coordination of experts and tools, to its resolution and then closure. At Google, when an incident is reported, our Detection & Response teams work to restore normal service as quickly as possible, while meeting both regulatory and contractual compliance requirements. They do this by following the five main steps in the Google incident response program:
Identification: Monitoring security events to detect and report on potential data incidents using advanced detection tools, signals, and alert mechanisms to provide early indication of potential incidents.
Coordination: Triaging the reports by gathering facts and assessing the severity of the incident based on factors such as potential harm to customers, nature of the incident, type of data that might be affected, and the impact of the incident on customers. A communication plan with appropriate leads is then determined.
Resolution: Gathering key facts about the incident such as root cause and impact, and integrating additional resources as needed to implement necessary fixes as part of remediation.
Closure: After the remediation efforts conclude, and after a data incident is resolved, reviewing the incident and response to identify key areas for improvement.
Continuous improvement: Is crucial for the development and maintenance of incident response programs. Teams work to improve the program based on lessons learned, ensuring that necessary teams, training, processes, resources, and tools are maintained.
Google’s Incident Response Process diagram flow
Our detection and response processes are critical in protecting our billions of global users from the growing threat landscape, which is why we’re continuously looking for ways to improve them with the latest technologies and techniques. The growth of generative AI has brought with it incredible potential in this area, and we were eager to explore how it could help us improve parts of the incident response process. We started by leveraging LLMs to not only pioneer modern approaches to incident response, but also to ensure that our processes are efficient and effective at scale.
Managing incidents can be a complex process and an additional factor is effective internal communication to leads, executives and stakeholders on the threats and status of incidents. Effective communication is critical as it properly informs executives so that they can take any necessary actions, as well as to meet regulatory requirements. Leveraging LLMs for this type of communication can save significant time for the incident commanders while improving quality at the same time.
Given that LLMs have summarization capabilities, we wanted to explore if they are able to generate summaries on par, or as well as humans can. We ran an experiment that took 50 human-written summaries from native and non-native English speakers, and 50 LLM-written ones with our finest (and final) prompt, and presented them to security teams without revealing the author.
We learned that the LLM-written summaries covered all of the key points, they were rated 10% higher than their human-written equivalents, and cut the time necessary to draft a summary in half.
Comparison of human vs LLM content completeness
Comparison of human vs LLM writing styles
Managing risks and protecting privacyLeveraging generative AI is not without risks. In order to mitigate the risks around potential hallucinations and errors, any LLM generated draft must be reviewed by a human. But not all risks are from the LLM - human misinterpretation of a fact or statement generated by the LLM can also happen. That is why it’s important to ensure there is human accountability, as well as to monitor quality and feedback over time.
Given that our incidents can contain a mixture of confidential, sensitive, and privileged data, we had to ensure we built an infrastructure that does not store any data. Every component of this pipeline - from the user interface to the LLM to output processing - has logging turned off. And, the LLM itself does not use any input or output for re-training. Instead, we use metrics and indicators to ensure it is working properly.
The type of data we process during incidents can be messy and often unstructured: Free-form text, logs, images, links, impact stats, timelines, and code snippets. We needed to structure all of that data so the LLM “knew” which part of the information serves what purpose. For that, we first replaced long and noisy sections of codes/logs by self-closing tags (<Code Section/> and <Logs/>) both to keep the structure while saving tokens for more important facts and to reduce risk of hallucinations.
During prompt engineering, we refined this approach and added additional tags such as <Title>, <Actions Taken>, <Impact>, <Mitigation History>, <Comment> so the input’s structure becomes closely mirrored to our incident communication templates. The use of self-explanatory tags allowed us to convey implicit information to the model and provide us with aliases in the prompt for the guidelines or tasks, for example by stating “Summarize the <Security Incident>”.
.png)
Sample {incident} input
Prompt engineeringOnce we added structure to the input, it was time to engineer the prompt. We started simple by exploring how LLMs can view and summarize all of the current incident facts with a short task:
Caption: First prompt version
Limits of this prompt:
The summary was too long, especially for executives trying to understand the risk and impact of the incident
Some important facts were not covered, such as the incident’s impact and its mitigation
The writing was inconsistent and not following our best practices such as “passive voice”, “tense”, “terminology” or “format”
Some irrelevant incident data was being integrated into the summary from email threads
The model struggled to understand what the most relevant and up-to-date information was
For version 2, we tried a more elaborate prompt that would address the problems above: We told the model to be concise and we explained what a well-written summary should be: About the main incident response steps (coordination and resolution).
Second prompt version
Limits of this prompt:
The summaries still did not always succinctly and accurately address the incident in the format we were expecting
At times, the model lost sight of the task or did not take all the guidelines into account
The model still struggled to stick to the latest updates
We noticed a tendency to draw conclusions on hypotheses with some minor hallucinations
For the final prompt, we inserted 2 human-crafted summary examples and introduced a <Good Summary> tag to highlight high quality summaries but also to tell the model to immediately start with the summary without first repeating the task at hand (as LLMs usually do).
Final prompt
This produced outstanding summaries, in the structure we wanted, with all key points covered, and almost without any hallucinations.
In integrating the prompt into our workflow, we wanted to ensure it was complementing the work of our teams, vs. solely writing communications. We designed the tooling in a way that the UI had a ‘Generate Summary’ button, which would pre-populate a text field with the summary that the LLM proposed. A human user can then either accept the summary and have it added to the incident, do manual changes to the summary and accept it, or discard the draft and start again.
UI showing the ‘generate draft’ button and LLM proposed summary around a fake incident
Quantitative wins
Our newly-built tool produced well-written and accurate summaries, resulting in 51% time saved, per incident summary drafted by an LLM, versus a human.
Time savings using LLM-generated summaries (sample size: 300)
The only edge cases we have seen were around hallucinations when the input size was small in relation to the prompt size. In these cases, the LLM made up most of the summary and key points were incorrect. We fixed this programmatically: If the input size is smaller than 200 tokens, we won’t call the LLM for a summary and let the humans write it.
Given these results, we explored other ways to apply and build upon the summarization success and apply it to more complex communications. We improved upon the initial summary prompt and ran an experiment to draft executive communications on behalf of the Incident Commander (IC). The goal of this experiment was to ensure executives and stakeholders quickly understand the incident facts, as well as allow ICs to relay important information around incidents. These communications are complex because they go beyond just a summary - they include different sections (such as summary, root cause, impact, and mitigation), follow a specific structure and format, as well as adhere to writing best practices (such as neutral tone, active voice instead of passive voice, minimize acronyms).
This experiment showed that generative AI can evolve beyond high level summarization and help draft complex communications. Moreover, LLM-generated drafts, reduced time ICs spent writing executive summaries by 53% of time, while delivering at least on-par content quality in terms of factual accuracy and adherence to writing best practices.
Uncovering potential threats to your web application by leveraging security reports
The Reporting API is an emerging web standard that provides a generic reporting mechanism for issues occurring on the browsers visiting your production website. The reports you receive detail issues such as security violations or soon-to-be-deprecated APIs, from users’ browsers from all over the world.
Collecting reports is often as simple as specifying an endpoint URL in the HTTP header; the browser will automatically start forwarding reports covering the issues you are interested in to those endpoints. However, processing and analyzing these reports is not that simple. For example, you may receive a massive number of reports on your endpoint, and it is possible that not all of them will be helpful in identifying the underlying problem. In such circumstances, distilling and fixing issues can be quite a challenge.
In this blog post, we'll share how the Google security team uses the Reporting API to detect potential issues and identify the actual problems causing them. We'll also introduce an open source solution, so you can easily replicate Google's approach to processing reports and acting on them.
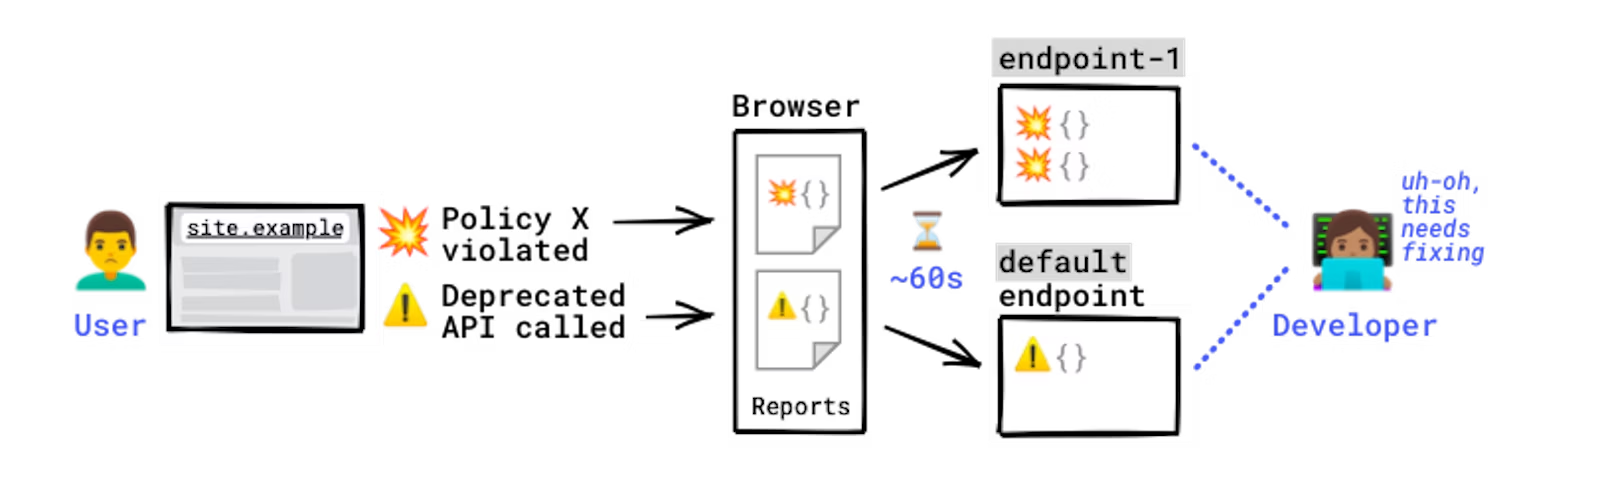
How does the Reporting API work?Some errors only occur in production, on users’ browsers to which you have no access. You won't see these errors locally or during development because there could be unexpected conditions real users, real networks, and real devices are in. With the Reporting API, you directly leverage the browser to monitor these errors: the browser catches these errors for you, generates an error report, and sends this report to an endpoint you've specified.
How reports are generated and sent.
Errors you can monitor with the Reporting API include:
- Security violations: Content-Security-Policy (CSP), Cross-Origin-Opener-Policy (COOP), Cross-Origin-Embedder-Policy (COEP)
- Deprecated and soon-to-be-deprecated API calls
- Browser interventions
- Permissions policy
- And more
For a full list of error types you can monitor, see use cases and report types.
The Reporting API is activated and configured using HTTP response headers: you need to declare the endpoint(s) you want the browser to send reports to, and which error types you want to monitor. The browser then sends reports to your endpoint in POST requests whose payload is a list of reports.
Example setup:
# Example setup to receive CSP violations reports, Document-Policy violations reports, and Deprecation reports
Reporting-Endpoints: main-endpoint="https://reports.example/main", default="https://reports.example/default"
# CSP violations and Document-Policy violations will be sent to `main-endpoint`
Content-Security-Policy: script-src 'self'; object-src 'none'; report-to main-endpoint;
Document-Policy: document-write=?0; report-to=main-endpoint;
# Deprecation reports are generated automatically and don't need an explicit endpoint; they're always sent to the `default` endpoint
Note: Some policies support "report-only" mode. This means the policy sends a report, but doesn't actually enforce the restriction. This can help you gauge if the policy is working effectively.
Chrome users whose browsers generate reports can see them in DevTools in the Application panel:
Example of viewing reports in the Application panel of DevTools.
You can generate various violations and see how they are received on a server in the reporting endpoint demo:
Example violation reports
The Reporting API is supported by Chrome, and partially by Safari as of March 2024. For details, see the browser support table.
Google's approachGoogle benefits from being able to uplift security at scale. Web platform mitigations like Content Security Policy, Trusted Types, Fetch Metadata, and the Cross-Origin Opener Policy help us engineer away entire classes of vulnerabilities across hundreds of Google products and thousands of individual services, as described in this blogpost.
One of the engineering challenges of deploying security policies at scale is identifying code locations that are incompatible with new restrictions and that would break if those restrictions were enforced. There is a common 4-step process to solve this problem:
- Roll out policies in report-only mode (CSP report-only mode example). This instructs browsers to execute client-side code as usual, but gather information on any events where the policy would be violated if it were enforced. This information is packaged in violation reports that are sent to a reporting endpoint.
- The violation reports must be triaged to link them to locations in code that are incompatible with the policy. For example, some code bases may be incompatible with security policies because they use a dangerous API or use patterns that mix user data and code.
- The identified code locations are refactored to make them compatible, for example by using safe versions of dangerous APIs or changing the way user input is mixed with code. These refactorings uplift the security posture of the code base by helping reduce the usage of dangerous coding patterns.
- When all code locations have been identified and refactored, the policy can be removed from report-only mode and fully enforced. Note that in a typical roll out, we iterate steps 1 through 3 to ensure that we have triaged all violation reports.
With the Reporting API, we have the ability to run this cycle using a unified reporting endpoint and a single schema for several security features. This allows us to gather reports for a variety of features across different browsers, code paths, and types of users in a centralized way.
Note: A violation report is generated when an entity is attempting an action that one of your policies forbids. For example, you've set CSP on one of your pages, but the page is trying to load a script that's not allowed by your CSP. Most reports generated via the Reporting API are violation reports, but not all — other types include deprecation reports and crash reports. For details, see Use cases and report types.
Unfortunately, it is common for noise to creep into streams of violation reports, which can make finding incompatible code locations difficult. For example, many browser extensions, malware, antivirus software, and devtools users inject third-party code into the DOM or use forbidden APIs. If the injected code is incompatible with the policy, this can lead to violation reports that cannot be linked to our code base and are therefore not actionable. This makes triaging reports difficult and makes it hard to be confident that all code locations have been addressed before enforcing new policies.
Over the years, Google has developed a number of techniques to collect, digest, and summarize violation reports into root causes. Here is a summary of the most useful techniques we believe developers can use to filter out noise in reported violations:
Focus on root causesIt is often the case that a piece of code that is incompatible with the policy executes several times throughout the lifetime of a browser tab. Each time this happens, a new violation report is created and queued to be sent to the reporting endpoint. This can quickly lead to a large volume of individual reports, many of which contain redundant information. Because of this, grouping violation reports into clusters enables developers to abstract away individual violations and think in terms of root causes. Root causes are simpler to understand and can speed up the process of identifying useful refactorings.
Let's take a look at an example to understand how violations may be grouped. For instance, a report-only CSP that forbids the use of inline JavaScript event handlers is deployed. Violation reports are created on every instance of those handlers and have the following fields set:
- The blockedURL field is set to inline, which describes the type of violation.
- The scriptSample field is set to the first few bytes of the contents of the event handler in the field.
- The documentURL field is set to the URL of the current browser tab.
Most of the time, these three fields uniquely identify the inline handlers in a given URL, even if the values of other fields differ. This is common when there are tokens, timestamps, or other random values across page loads. Depending on your application or framework, the values of these fields can differ in subtle ways, so being able to do fuzzy matches on reporting values can go a long way in grouping violations into actionable clusters. In some cases, we can group violations whose URL fields have known prefixes, for example all violations with URLs that start with chrome-extension, moz-extension, or safari-extension can be grouped together to set root causes in browser extensions aside from those in our codebase with a high degree of confidence.
Developing your own grouping strategies helps you stay focused on root causes and can significantly reduce the number of violation reports you need to triage. In general, it should always be possible to select fields that uniquely identify interesting types of violations and use those fields to prioritize the most important root causes.
Leverage ambient informationAnother way of distinguishing non-actionable from actionable violation reports is ambient information. This is data that is contained in requests to our reporting endpoint, but that is not included in the violation reports themselves. Ambient information can hint at sources of noise in a client's set up that can help with triage:
- User Agent or User Agent client hints: User agents are a great tell-tale sign of non-actionable violations. For example, crawlers, bots, and some mobile applications use custom user agents whose behavior differs from well-supported browser engines and that can trigger unique violations. In other cases, some violations may only trigger in a specific browser or be caused by changes in nightly builds or newer versions of browsers. Without user agent information, these violations would be significantly more difficult to investigate.
- Trusted users: Browsers will attach any available cookies to requests made to a reporting endpoint by the Reporting API, if the endpoint is same-site with the document where the violation occurs. Capturing cookies is useful for identifying the type of user that caused a violation. Often, the most actionable violations come from trusted users that are not likely to have invasive extensions or malware, like company employees or website administrators. If you are not able to capture authentication information through your reporting endpoint, consider rolling out report-only policies to trusted users first. Doing so allows you to build a baseline of actionable violations before rolling out your policies to the general public.
- Number of unique users: As a general principle, users of typical features or code paths should generate roughly the same violations. This allows us to flag violations seen by a small number of users as potentially suspicious, since they suggest that a user's particular setup might be at fault, rather than our application code. One way of 'counting users' is to keep note of the number of unique IP addresses that reported a violation. Approximate counting algorithms are simple to use and can help gather this information without tracking specific IP addresses. For example, the HyperLogLog algorithm requires just a few bytes to approximate the number of unique elements in a set with a high degree of confidence.
Some types of violations have a source_file field or equivalent. This field represents the JavaScript file that triggered the violation and is usually accompanied by a line and column number. These three bits of data are a high-quality signal that can point directly to lines of code that need to be refactored.
Nevertheless, it is often the case that source files fetched by browsers are compiled or minimized and don't map directly to your code base. In this case, we recommend you use JavaScript source maps to map line and column numbers between deployed and authored files. This allows you to translate directly from violation reports to lines of source code, yielding highly actionable report groups and root causes.
Establish your own solutionThe Reporting API sends browser-side events, such as security violations, deprecated API calls, and browser interventions, to the specified endpoint on a per-event basis. However, as explained in the previous section, to distill the real issues out of those reports, you need a data processing system on your end.
Fortunately, there are plenty of options in the industry to set up the required architecture, including open source products. The fundamental pieces of the required system are the following:
- API endpoint: A web server that accepts HTTP requests and handles reports in a JSON format
- Storage: A storage server that stores received reports and reports processed by the pipeline
- Data pipeline: A pipeline that filters out noise and extracts and aggregates required metadata into constellations
- Data visualizer: A tool that provides insights on the processed reports
Solutions for each of the components listed above are made available by public cloud platforms, SaaS services, and as open source software. See the Alternative solutions section for details, and the following section outlining a sample application.
Sample application: Reporting API ProcessorTo help you understand how to receive reports from browsers and how to handle these received reports, we created a small sample application that demonstrates the following processes that are required for distilling web application security issues from reports sent by browsers:
- Report ingestion to the storage
- Noise reduction and data aggregation
- Processed report data visualization
Although this sample is relying on Google Cloud, you can replace each of the components with your preferred technologies. An overview of the sample application is illustrated in the following diagram:
Components described as green boxes are components that you need to implement by yourself. Forwarder is a simple web server that receives reports in the JSON format and converts them to the schema for Bigtable. Beam-collector is a simple Apache Beam pipeline that filters noisy reports, aggregates relevant reports into the shape of constellations, and saves them as CSV files. These two components are the key parts to make better use of reports from the Reporting API.
Try it yourselfBecause this is a runnable sample application, you are able to deploy all components to a Google Cloud project and see how it works by yourself. The detailed prerequisites and the instructions to set up the sample system are documented in the README.md file.
Alternative solutionsAside from the open source solution we shared, there are a number of tools available to assist in your usage of the Reporting API. Some of them include:
- Report-collecting services like report-uri and uriports.
- Application error monitoring platforms like Sentry, Datadog, etc.
Besides pricing, consider the following points when selecting alternatives:
- Are you comfortable sharing any of your application's URLs with a third-party report collector? Even if the browser strips sensitive information from these URLs, sensitive information may get leaked this way. If this sounds too risky for your application, operate your own reporting endpoint.
- Does this collector support all report types you need? For example, not all reporting endpoint solutions support COOP/COEP violation reports.
In this article, we explained how web developers can collect client-side issues by using the Reporting API, and the challenges of distilling the real problems out of the collected reports. We also introduced how Google solves those challenges by filtering and processing reports, and shared an open source project that you can use to replicate a similar solution. We hope this information will motivate more developers to take advantage of the Reporting API and, in consequence, make their website more secure and sustainable.
Learning resourcesPrevent Generative AI Data Leaks with Chrome Enterprise DLP
Generative AI has emerged as a powerful and popular tool to automate content creation and simple tasks. From customized content creation to source code generation, it can increase both our productivity and creative potential.
Businesses want to leverage the power of LLMs, like Gemini, but many may have security concerns and want more control around how employees make sure of these new tools. For example, companies may want to ensure that various forms of sensitive data, such as Personally Identifiable Information (PII), financial records and internal intellectual property, is not to be shared publicly on Generative AI platforms. Security leaders face the challenge of finding the right balance — enabling employees to leverage AI to boost efficiency, while also safeguarding corporate data.
In this blog post, we'll explore reporting and enforcement policies that enterprise security teams can implement within Chrome Enterprise Premium for data loss prevention (DLP).
1. View login events* to understand usage of Generative AI services within the organization. With Chrome Enterprise's Reporting Connector, security and IT teams can see when a user successfully signs into a specific domain, including Generative AI websites. Security Operations teams can further leverage this telemetry to detect anomalies and threats by streaming the data into Chronicle or other third-party SIEMs at no additional cost.
2. Enable URL Filtering to warn users about sensitive data policies and let them decide whether or not they want to navigate to the URL, or to block users from navigating to certain groups of sites altogether.
.png)
For example, with Chrome Enterprise URL Filtering, IT admins can create rules that warn developers not to submit source code to specific Generative AI apps or tools, or block them.
3. Warn, block or monitor sensitive data actions within Generative AI websites with dynamic content-based rules for actions like paste, file uploads/downloads, and print. Chrome Enterprise DLP rules give IT admins granular control over browser activities, such as entering financial information in Gen AI websites. Admins can customize DLP rules to restrict the type and amount of data entered into these websites from managed browsers.
For most organizations, safely leveraging Generative AI requires a certain amount of control. As enterprises work through their policies and processes involving GenAI, Chrome Enterprise Premium empowers them to strike the balance that works best. Hear directly from security leaders at Snap on their use of DLP for Gen AI in this recording here.
Learn more about how Chrome Enterprise can secure businesses just like yours here.
*Available at no additional cost in Chrome Enterprise Core
How we built the new Find My Device network with user security and privacy in mind
Keeping people safe and their data secure and private is a top priority for Android. That is why we took our time when designing the new Find My Device, which uses a crowdsourced device-locating network to help you find your lost or misplaced devices and belongings quickly – even when they’re offline. We gave careful consideration to the potential user security and privacy challenges that come with device finding services.
During development, it was important for us to ensure the new Find My Device was secure by default and private by design. To build a private, crowdsourced device-locating network, we first conducted user research and gathered feedback from privacy and advocacy groups. Next, we developed multi-layered protections across three main areas: data safeguards, safety-first protections, and user controls. This approach provides defense-in-depth for Find My Device users.
How location crowdsourcing works on the Find My Device network
The Find My Device network locates devices by harnessing the Bluetooth proximity of surrounding Android devices. Imagine you drop your keys at a cafe. The keys themselves have no location capabilities, but they may have a Bluetooth tag attached. Nearby Android devices participating in the Find My Device network report the location of the Bluetooth tag. When the owner realizes they have lost their keys and logs into the Find My Device mobile app, they will be able to see the aggregated location contributed by nearby Android devices and locate their keys.
Find My Device network protections
Let’s dive into key details of the multi-layered protections for the Find My Device network:
- Data Safeguards: We’ve implemented protections that help ensure the privacy of everyone participating in the network and the crowdsourced location data that powers it.
- Location data is end-to-end encrypted. When Android devices participating in the network report the location of a Bluetooth tag, the location is end-to-end encrypted using a key that is only accessible to the Bluetooth tag owner and anyone the owner has shared the tag with in the Find My Device app. Only the Bluetooth tag owner (and those they’ve chosen to share access with) can decrypt and view the tag’s location. With end-to-end encrypted location data, Google cannot decrypt, see, or otherwise use the location data.
- Private, crowdsourced location reports. These end-to-end encrypted locations are contributed to the Find My Device network in a manner that does not allow Google to identify the owners of the nearby Android devices that provided the location data. And when the Find My Device network shows the location and timestamp to the Bluetooth tag’s owner to help them find their belongings, no other information about the nearby Android devices that contributed the data is included.
- Minimizing network data. End-to-end encrypted location data is minimally buffered and frequently overwritten. In addition, if the network can help find a Bluetooth tag using the owner’s nearby devices (e.g., if their own phone detects the tag), the network will discard crowdsourced reports for the tag.
- Safety-first Protections: The Find My Device network protects against risks such as use of an unknown Bluetooth tag to stalk or identify another user, including:
- Aggregation by default. This is a first-of-its-kind safety protection that makes unwanted tracking to a private location, like your home, more difficult. By default, the Find My Device network requires multiple nearby Android devices to detect a tag before reporting its location to the tag's owner. Our research found that the Find My Device network is most valuable in public settings like cafes and airports, where there are likely many devices nearby. By implementing aggregation before showing a tag’s location to its owner, the network can take advantage of its biggest strength – over a billion Android devices that can participate. This helps tag owners find their lost devices in these busier locations while prioritizing safety from unwanted tracking near private locations. In less busy areas, last known location and Nest finding are reliable ways to locate items.
- At home protection. If a user has chosen to save their home address in their Google Account, their Android device will also ensure that it does not contribute crowdsourced location reports to the Find My Device network when it is near the user’s home. This provides additional protection on top of aggregation by default against unwanted tracking near private locations.
- Rate limiting and throttling. The Find My Device network limits the number of times that a nearby Android device can contribute a location report for a particular Bluetooth tag. The network also throttles how frequently the owner of a Bluetooth tag can request an updated location for the tag. We've found that lost items are typically left behind in stationary spots. For example, you lose your keys at the cafe, and they stay at the table where you had your morning coffee. Meanwhile, a malicious user is often trying to engage in real-time tracking of a person. By applying rate limiting and throttling to reduce how often the location of a device is updated, the network continues to be helpful for finding items, like your lost checked baggage on a trip, while helping mitigate the risk of real-time tracking.
- Unknown tracker alerts. The Find My Device network is also compliant with the integration version of the joint industry standard for unwanted tracking. Being compliant with the integration version of the standard means that both Android and iOS users will receive unknown tracker alerts if the on-device algorithm detects that someone may be using a Find My Device network-compatible tag to track them without their knowledge, proactively alerting the user through a notification on their phone.
- User Controls: Android users always have full control over which of their devices participate in the Find My Device network and how those devices participate. Users can either stick with the default and contribute to aggregated location reporting, opt into contributing non-aggregated locations, or turn the network off altogether. Find My Device also provides the ability to secure or erase data from a lost device.
In addition to careful security architectural design, the new Find My Device network has undergone internal Android red team testing. The Find My Device network has also been added to the Android security vulnerability rewards program to take advantage of Android’s global ecosystem of security researchers. We’re also engaging with select researchers through our private grant program to encourage more targeted research.
Prioritizing user safety on Find My Device
Together, these multi-layered user protections help mitigate potential risks to user privacy and safety while allowing users to effectively locate and recover lost devices.
As bad actors continue to look for new ways to exploit users, our work to help keep users safe on Android is never over. We have an unwavering commitment to continue to improve user protections on Find My Device and prioritize user safety.
For more information about Find My Device on Android, please visit our help center. You can read the Find My Device Network Accessory specification here.